You should probably be charging more for that
I thought I’d make a quick post showing just how fast you can generate new revenue using data insight and analysis.
During the data audit process for one of my clients, I noted that they weren’t doing a great job gathering data from the regular newsletters they were sending out to their email list.
So we stitched up some new data collection frameworks which massively increased the granularity of the information we were receiving about how users were interacting with these emails.
Part of the revenue generated from these regular emails comes from ads, which are purchased by companies who want to gain exposure to this company’s subscribers – a pretty common practice.
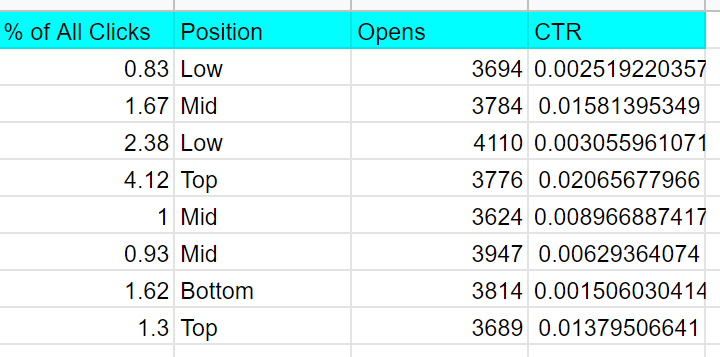
When we analysed the data from these newsletters, we noted that the position of the ad in the newsletter (Top, Middle or Bottom) had a MASSIVE impact on Click Through Rate and total number of clicks.
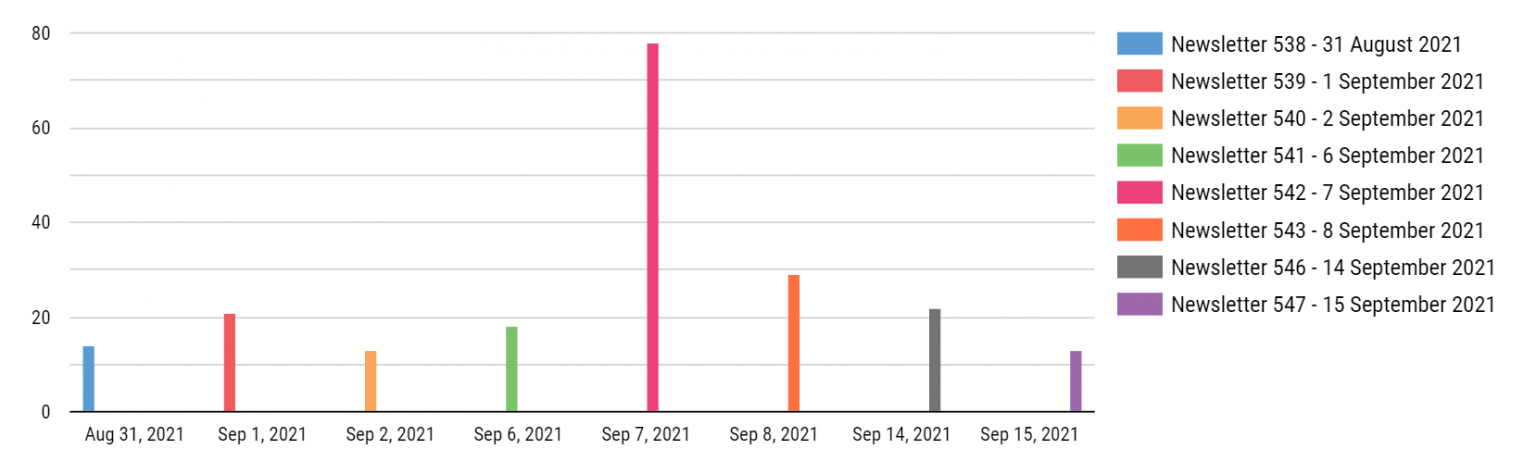
We visualised the number of clicks a particular advertiser had recieved on their ads in the newsletter, broken down by newsletter date. Can you guess which newsletter featured this clients ad at the very top?
I then had the following conversation with the client:
Me:
“There’s a huge difference in ad performance based on the position of the ad in the newsletter. Top positions are way more valuable. Are you varying your pricing based on ad position?”Client:
“Well no, not currently”Me:
“Take this data to your prospective advertising clients and double your pricing for top position ad slots”Client:
“OK”
The result? 76% increase in newsletter ad revenue month on month.
Remember you can’t improve what you’re not measuring – but once you’ve got a data and analysis framework in place, the opportunities are endless!
We’re here to design and build these frameworks for you – get in touch with us!